ZIP Market Deep-Dive · Washington, DC · May 2026
ZipBrief by Real Estate on Purpose May 2026
ZIP Market Deep-Dive · Washington, DC

Your market,
three layers deep.

1
Washington, DC neighborhoods — each read across seven cross-checked data sources, honestly labeled.
1 / 1
ZIPs now favor buyers
−1.6%
Real home-value trend, YoY average
6.48%
30-yr fixed — down 0.37 pts in a year
ZR
Prepared for the sphere of
ZipBrief Research
Market Data Team · ZipBrief by Real Estate on Purpose
Reporting window
Data through May 2026
realestateonpurpose.com/marketreport
ZipBrief by Real Estate on Purpose
Market Deep-Dive · May 2026
What’s inside

Contents

How to read this report — three sources, one honest picture
Sale medians
What homes actually closed for, on 90-day rolling windows. Jumps when the mix of homes selling shifts — not always when prices move.
Source · Redfin
Value index
A smoothed, gap-free estimate of what a typical home is worth. The number to trust for “what is my home doing.”
Source · Zillow ZHVI
Listings & leverage
Asking prices, price cuts, days on market and supply — the live signals of who holds negotiating power right now.
Source · Realtor.com
When these sources disagree, it usually means the kind of home selling changed — not that values jumped. Each page flags that, and trusts the smoothed value index for what your home is really worth.
REOP Prepared for the sphere of ZipBrief Research · ZipBrief by Real Estate on Purpose Page 2 / 4
Shaw / Logan Circle
ZIP 20001 · Section 01
Section 01 ZIP 20001

Shaw / Logan Circle

Lean buyer's market
Who holds leverage29/100 seller leverage
◀ BuyersBalancedSellers ▶
Over-asking 23Sale speed 15Price cuts 68Supply 10
Buyer attention 40/100 — hotter than 87% of its own last five years · Realtor.com hotness, Apr 2026
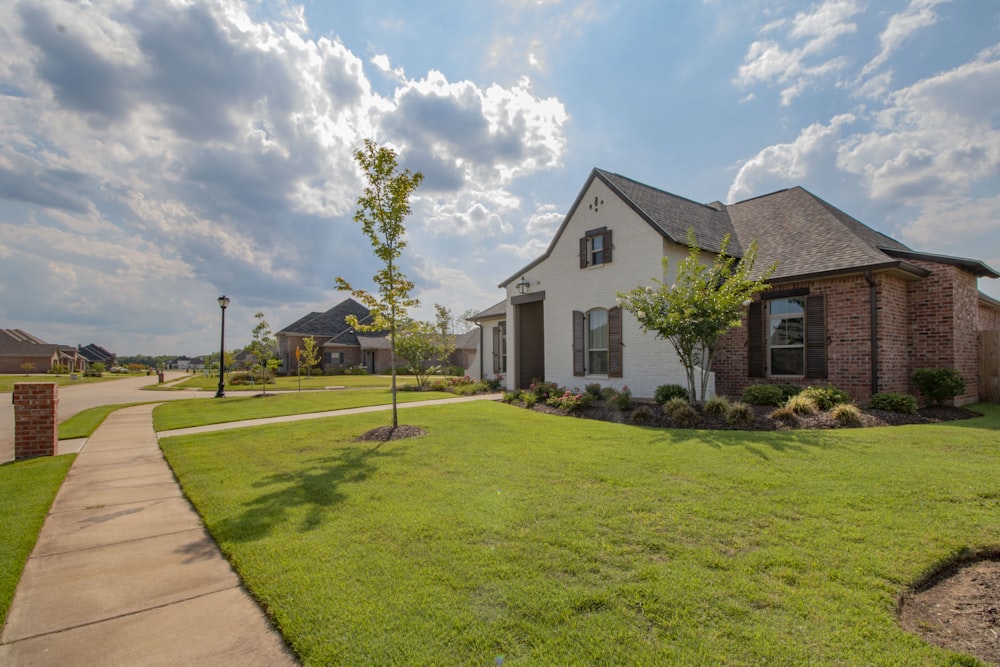
Neighborhood streetscape

Shaw / Logan Circle leans toward buyers — friendlier to them than in 71% of the last five years. Headline sale prices ticked up +1.7%, but a typical home’s value is actually −1.6% year over year.

$756K
Median sale · +1.7% YoY
$638K
Real value index · −1.6% YoY
65
Median days on market
21.0%
Listings with a price cut

By property type

90-day window · May 2026
TypeMedianSale YoYValue YoYSold
Single-family thin$788,500−3.5%2
Townhouse$901,867+6.1%54
Condo / co-op$600,000+6.2%−0.9%39
Multi-family thin$855,000−32.7%5

Do the sources agree?

Redfin sale median
+1.7%
Zillow value index
−1.6%
Realtor list median
−13.3%

Diverging. The mix of homes selling shifted this quarter. For what your home is doing, trust the smoothed value index: −1.6%.

Sources disagree on Shaw. Talk to ZipBrief for what it means for your home.

Five-year value trend

Apr 2021 · $700KApr 2026 · $638K
Moving 1.1 pts behind the Washington, DC metro overall (−1.6% vs −0.5%).

When this ZIP rewards sellers

J
F
M
A
M
J
J
A
S
O
N
D

Homes listed to close in July sold above asking 38.9% of the time on average — vs just 21.1% in February.

$2,603/mo
Typical rent · −0.1% YoY
20.4
Price-to-rent ratio
Renting stays cheap relative to owning here.
What it means
REOP Prepared for the sphere of ZipBrief Research · ZipBrief by Real Estate on Purpose Page 3 / 4
The month in one minute
Summary · Section 02
Summary

1 neighborhoods, one honest read

Buyers hold the leverage across all of these ZIPs — and the headline prices are quieter than they look.

Shaw / Logan CircleZIP 20001Lean buyer's market
Sale median +1.7%, but a typical home’s value is −1.6% — the gap is mix, not momentum. 21.0% of listings have cut their price.
Real value vs the Washington, DC metro Zillow index, YoY
Shaw / Logan Circle20001
−1.6%
Washington, DC metro overallbenchmark
−0.5%

Each bar is the smoothed value index against the metro benchmark — the honest read on where values are actually moving.

6.48%
Average 30-year fixed mortgage rate, down 0.37 pts from a year ago.
National average · Freddie Mac via FRED · week of 2026-06-04
Three things to take from this month
Buyers hold the leverage
1 of 1 ZIPs favor buyers more than they have in most of the last five years. More price cuts, slower sales, fewer bidding wars — room to negotiate.
The headline is a mirage
Closing medians swung from +1.7% to +1.7%, yet every value index is flat to slightly down. The jumps are which homes sold, not your home gaining value.
Timing still matters
Each ZIP has its own sweet spot — July in Shaw — when homes most often sell above asking. Listing date is a lever.
The bottom line

Across these neighborhoods, buyers have quietly gained the upper hand — and the splashy sale-price headlines mostly reflect a richer mix of homes selling, not rising values. For a homeowner, that means price to the smoothed value index, lean on seasonal timing, and use the falling rate as the conversation-starter with anyone weighing a move. The fundamentals are steady; the strategy is patience and precision.

Wondering what this means for your home? Talk to ZipBrief